spudtrooper
citibike rides
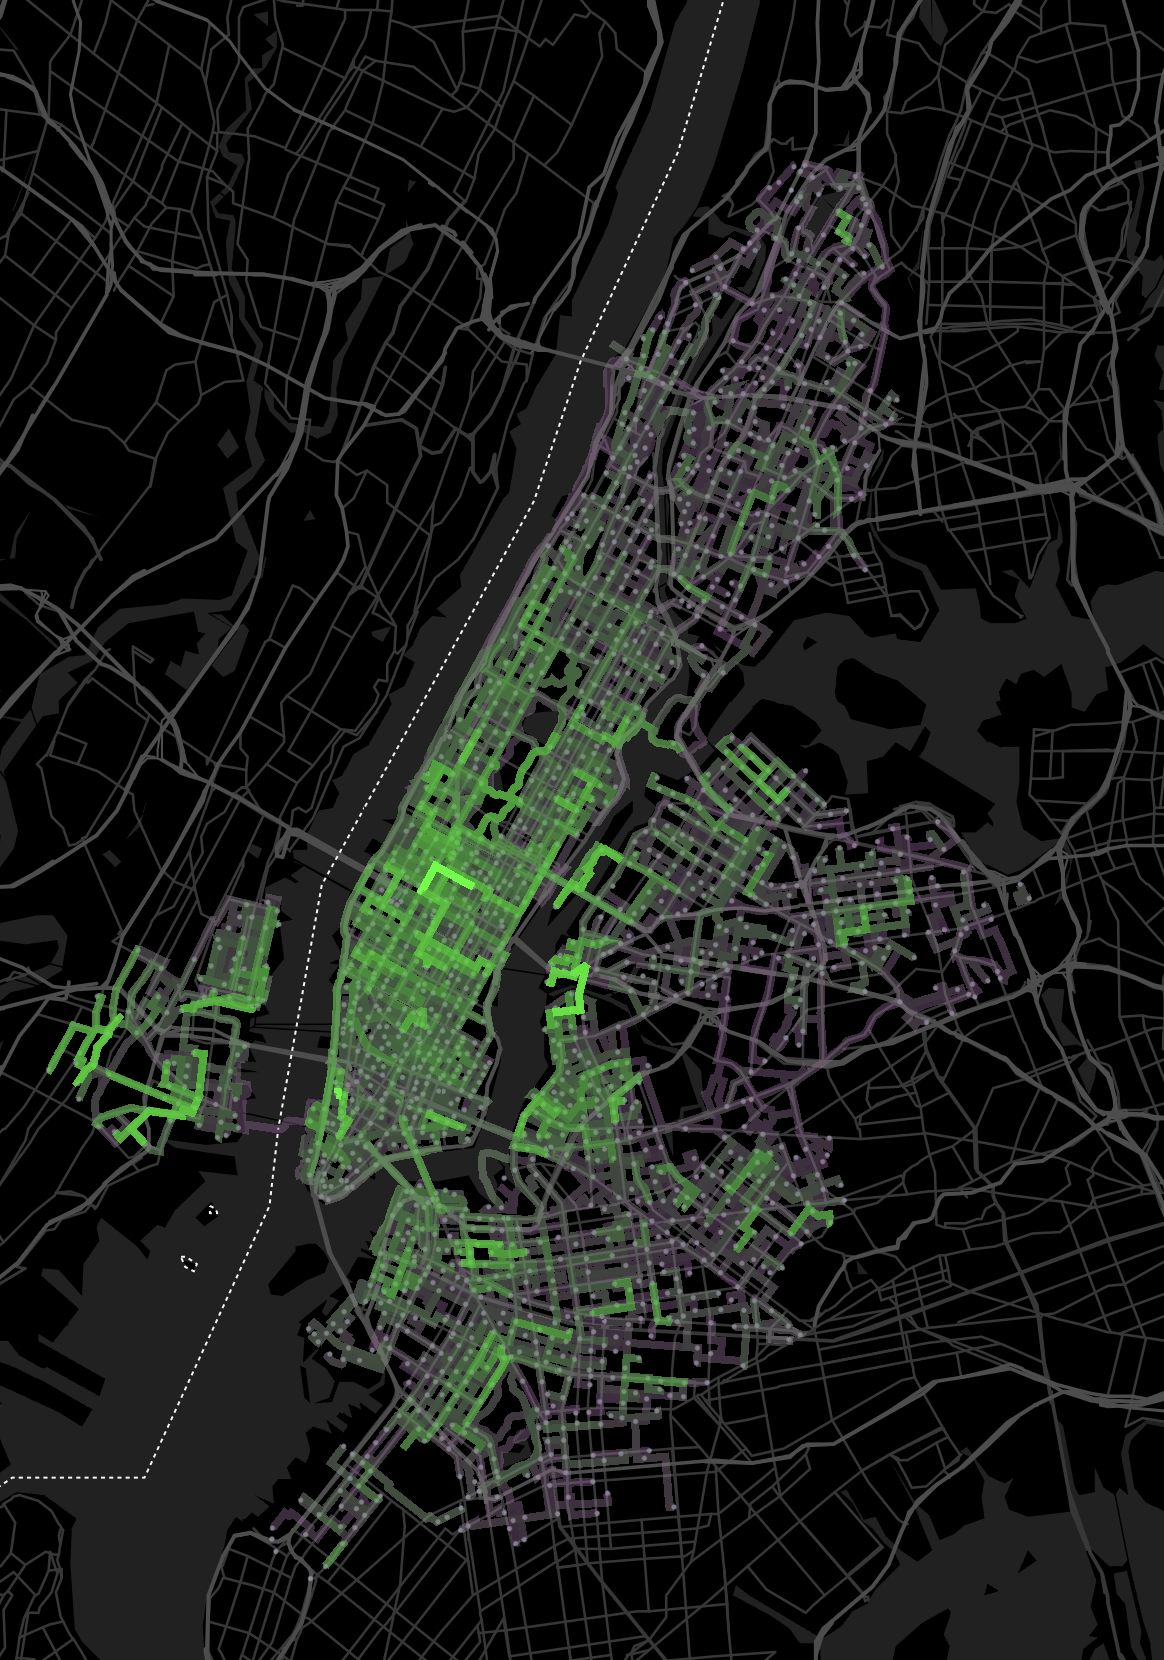
Here’s a heat map showing the relative traffic density of citibikes over about a week in NYC. There is nothing particularly insightful, but I like the colors.

Here’s a heat map showing the relative traffic density of citibikes over about a week in NYC. There is nothing particularly insightful, but I like the colors.
